Overview
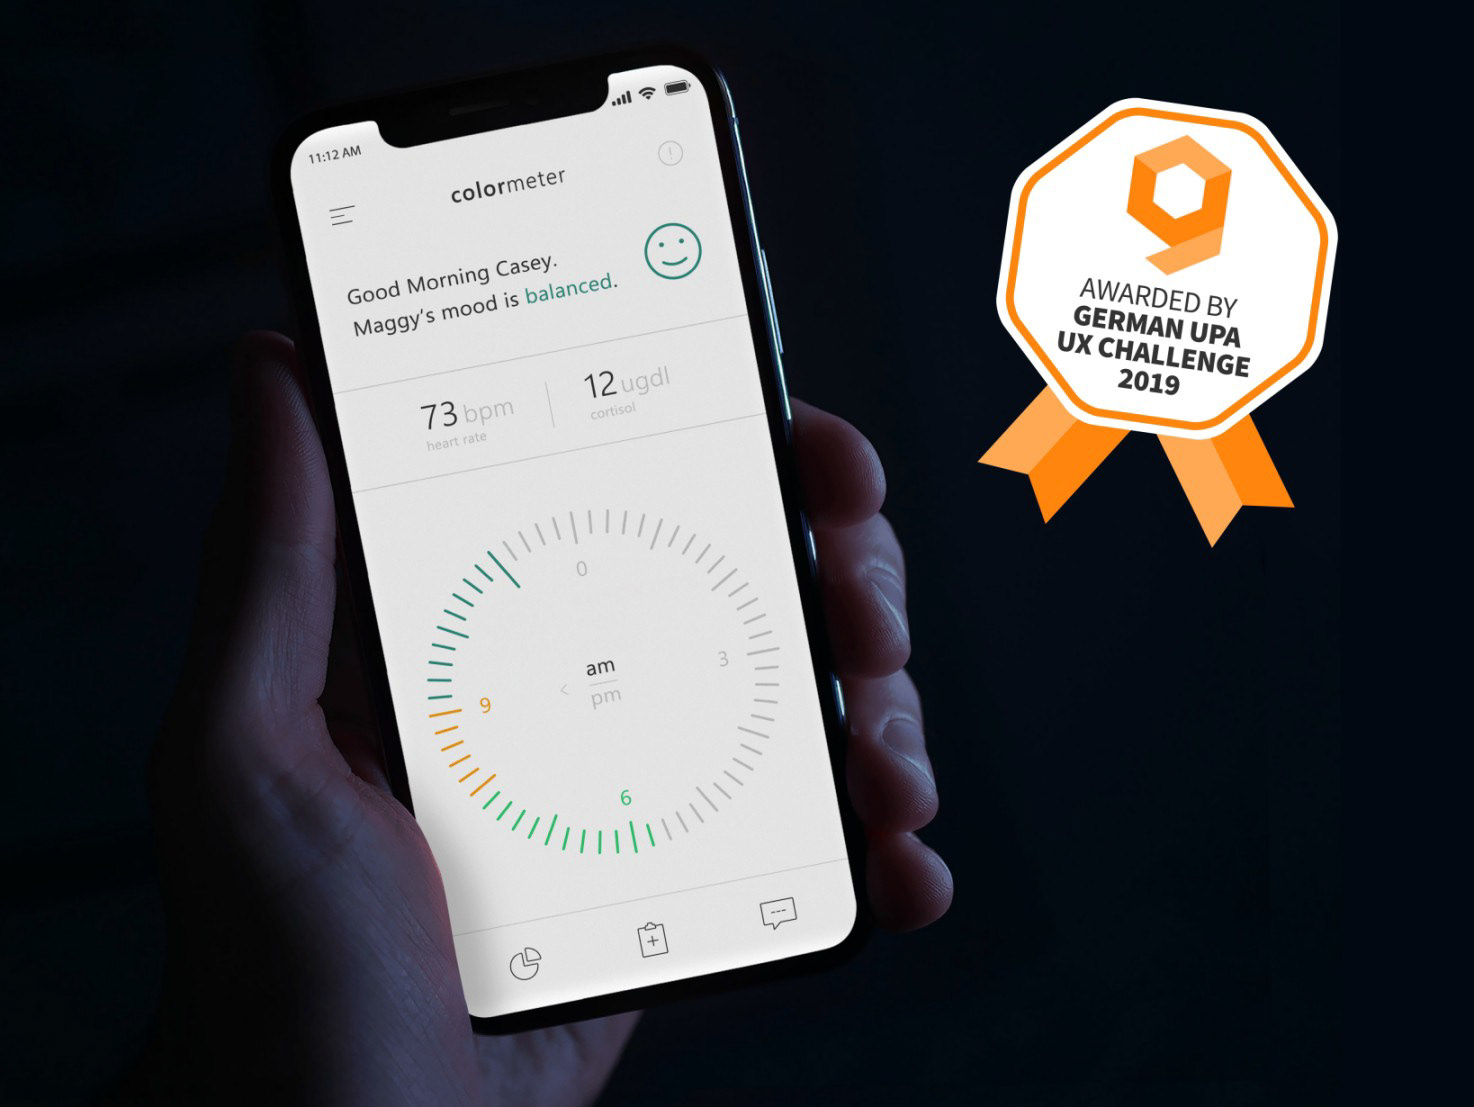
Colormeter is a app concept that visualizes emotional states of young people with Borderline Personality Disorder. As UX/UI Designer, I translated user research into paper prototypes and tested wireframes, shaping an intuitive and empathetic interface that makes emotional patterns understandable and actionable. The project was awarded at the German UPA UX Challenge 2019.
Role
Lead UX/UI Designer
Scope
User Research
UX Concept
UI Design
UX Concept
UI Design
Platform
Mobile
Duration
~ 4 months
Tools
Balsamiq
Illustrator
Photosthop
InDesign
After Effects
Premiere
Illustrator
Photosthop
InDesign
After Effects
Premiere
Context
Borderline Personality Disorder (BPD) affects around three percent of the global population and often emerges in adolescence. Rapid emotional shifts, impulsivity, and unstable relationships challenge young people and their families, often leading parents to intervene too late or misinterpret escalation. Colormeter translates physiological stress signals into an approachable, color-based visual system. Our hypothesis was that externalizing stress through a shared visual language would enable earlier intervention and improve mutual understanding.
UCD Approach
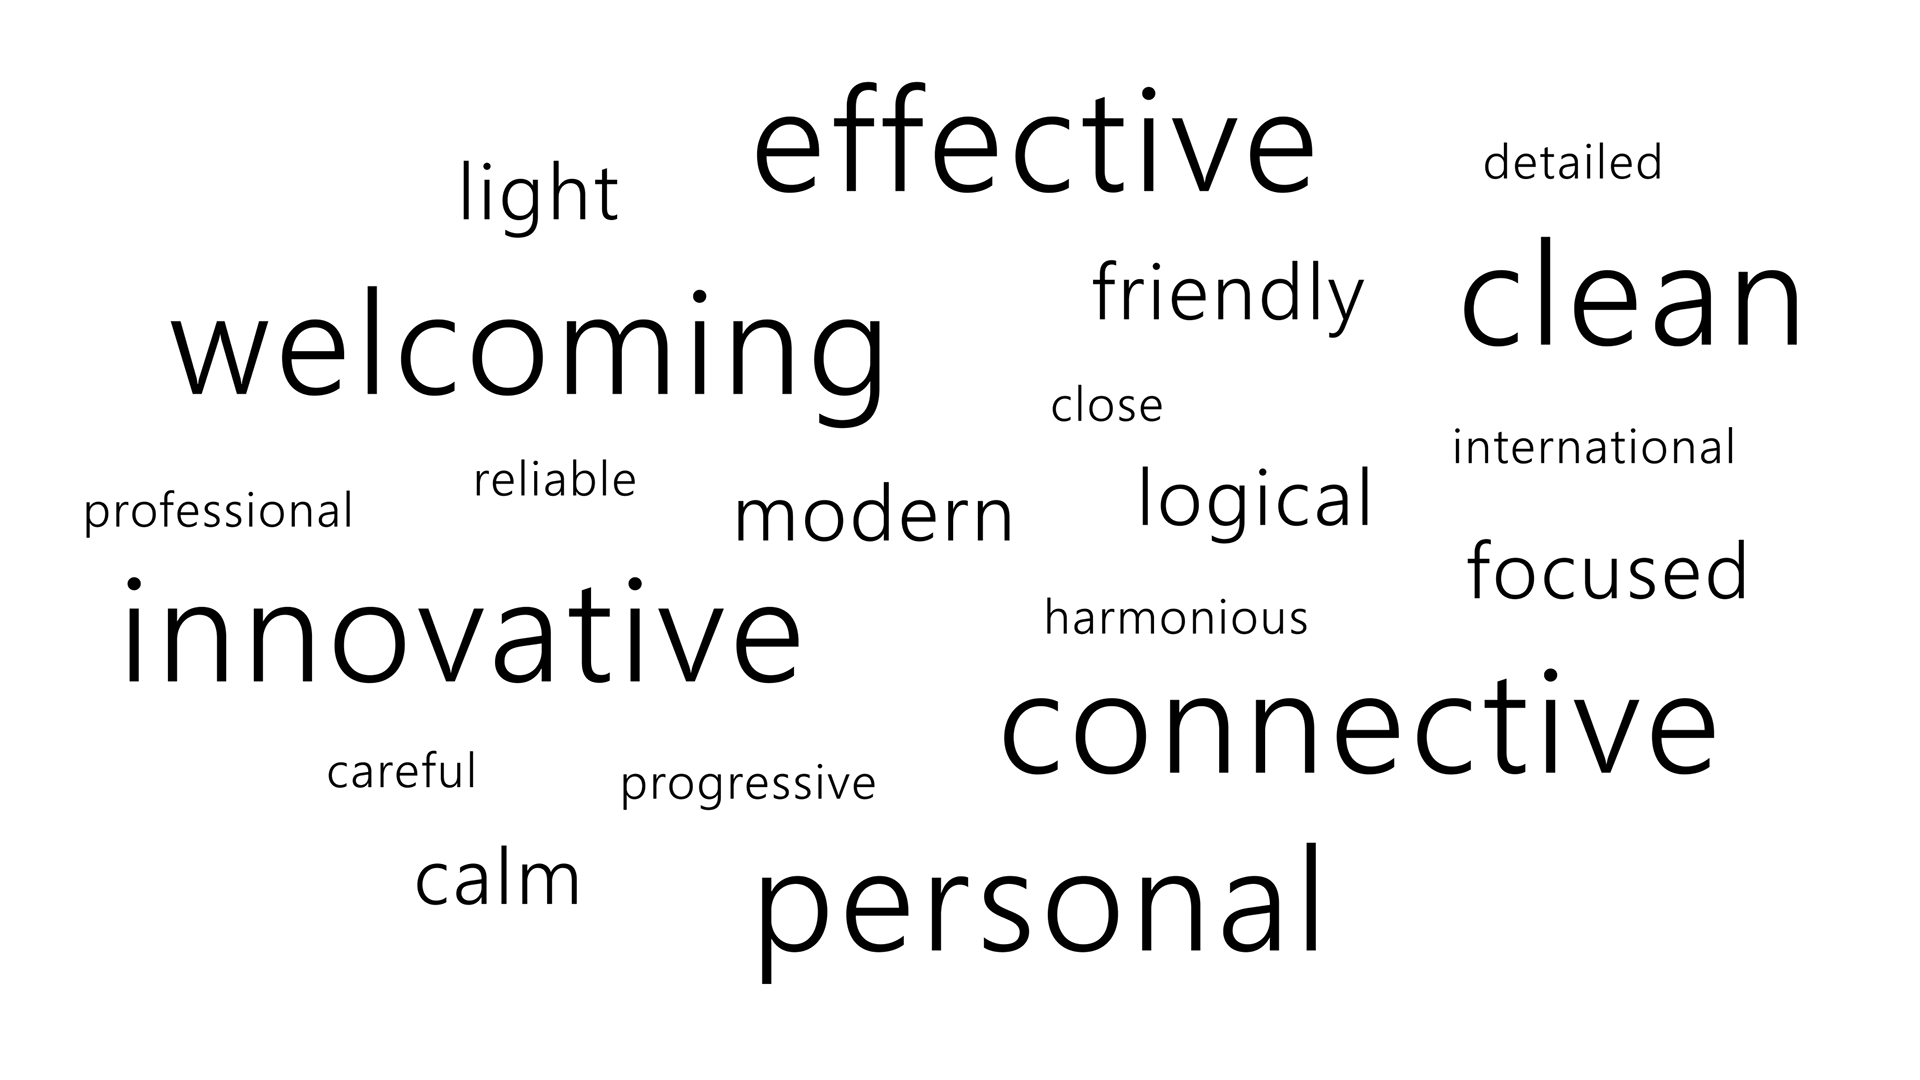
We conducted interviews with individuals diagnosed with BPD and their relatives to understand escalation patterns and communication challenges. These insights informed key Jobs to Be Done: enabling early awareness of rising stress, providing a clear visual language to support reflective responses, and making emotional patterns over time visible to guide long-term support. We synthesized these findings into a persona to ground decisions in real behaviors and needs. The resulting visual system is intentionally minimal and calm, using color as the primary interaction layer to communicate emotional nuance.
Moodboard
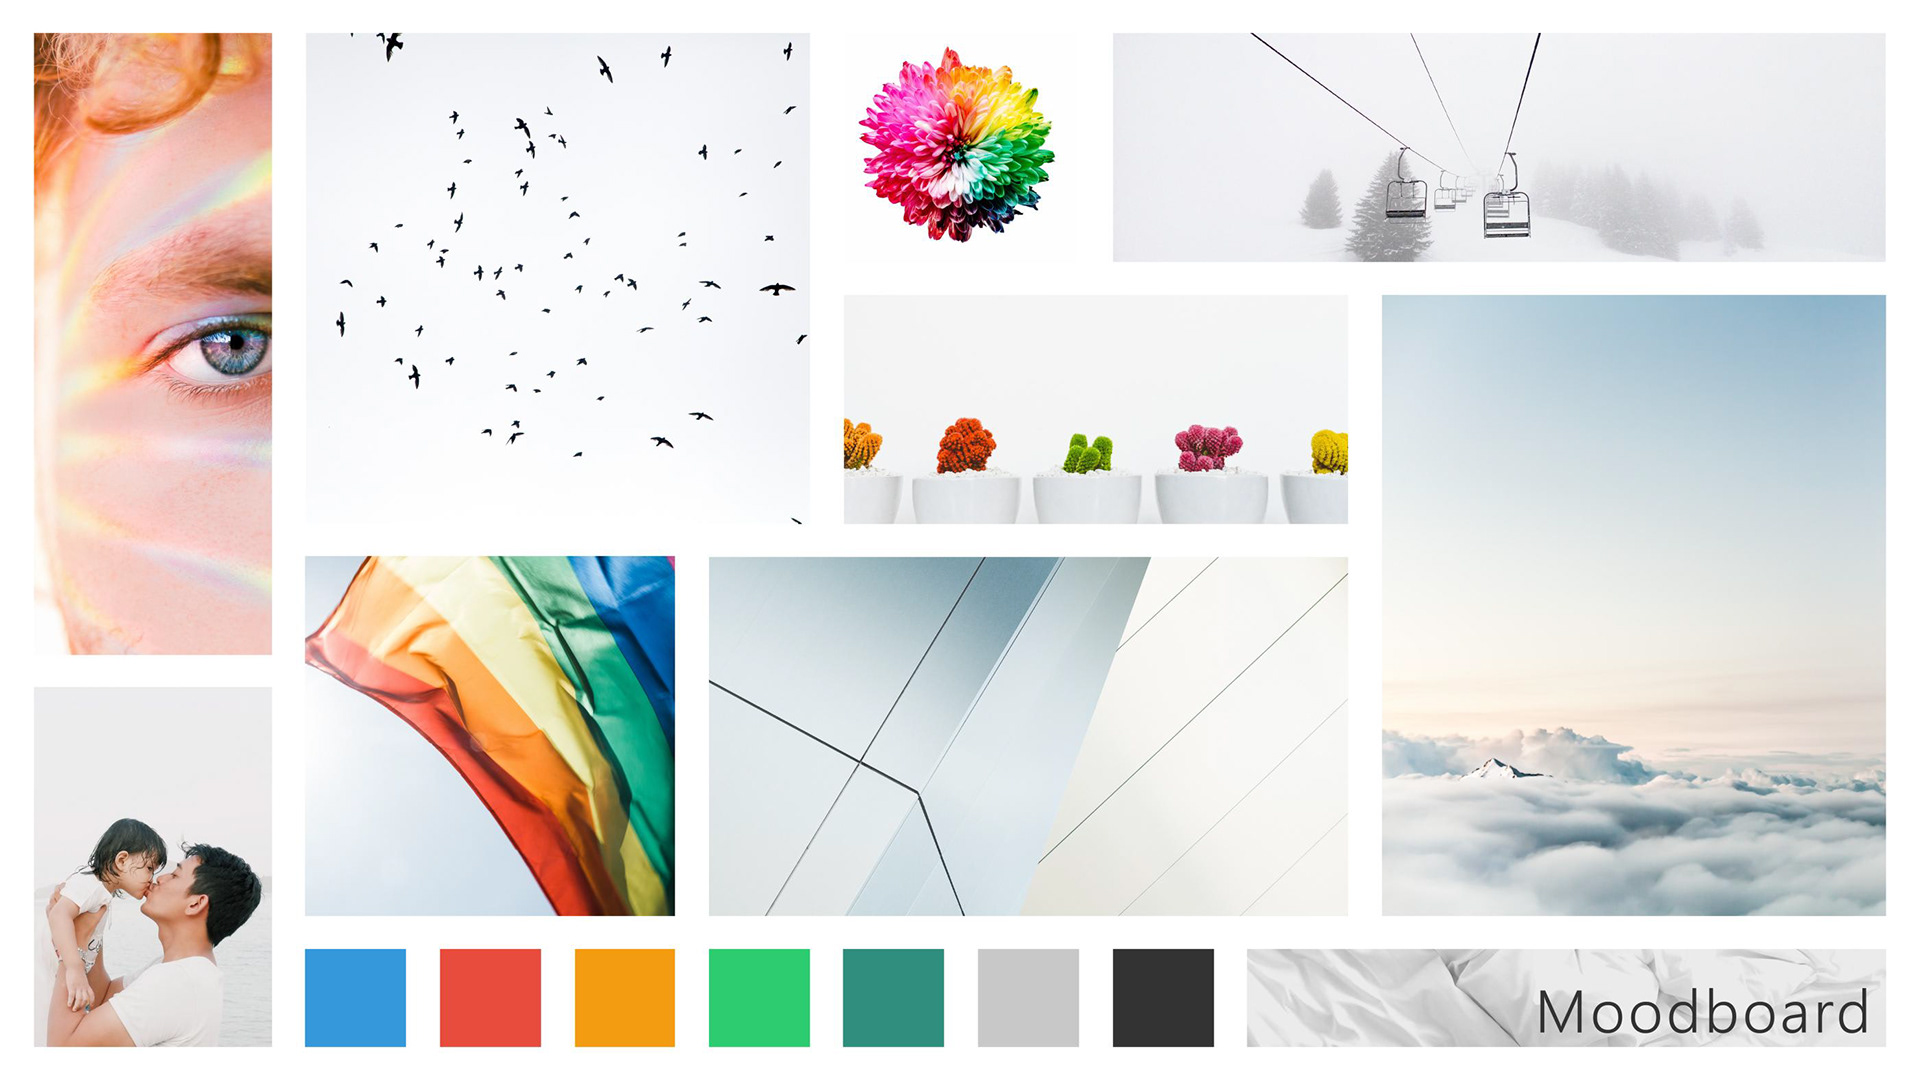
Moodboard
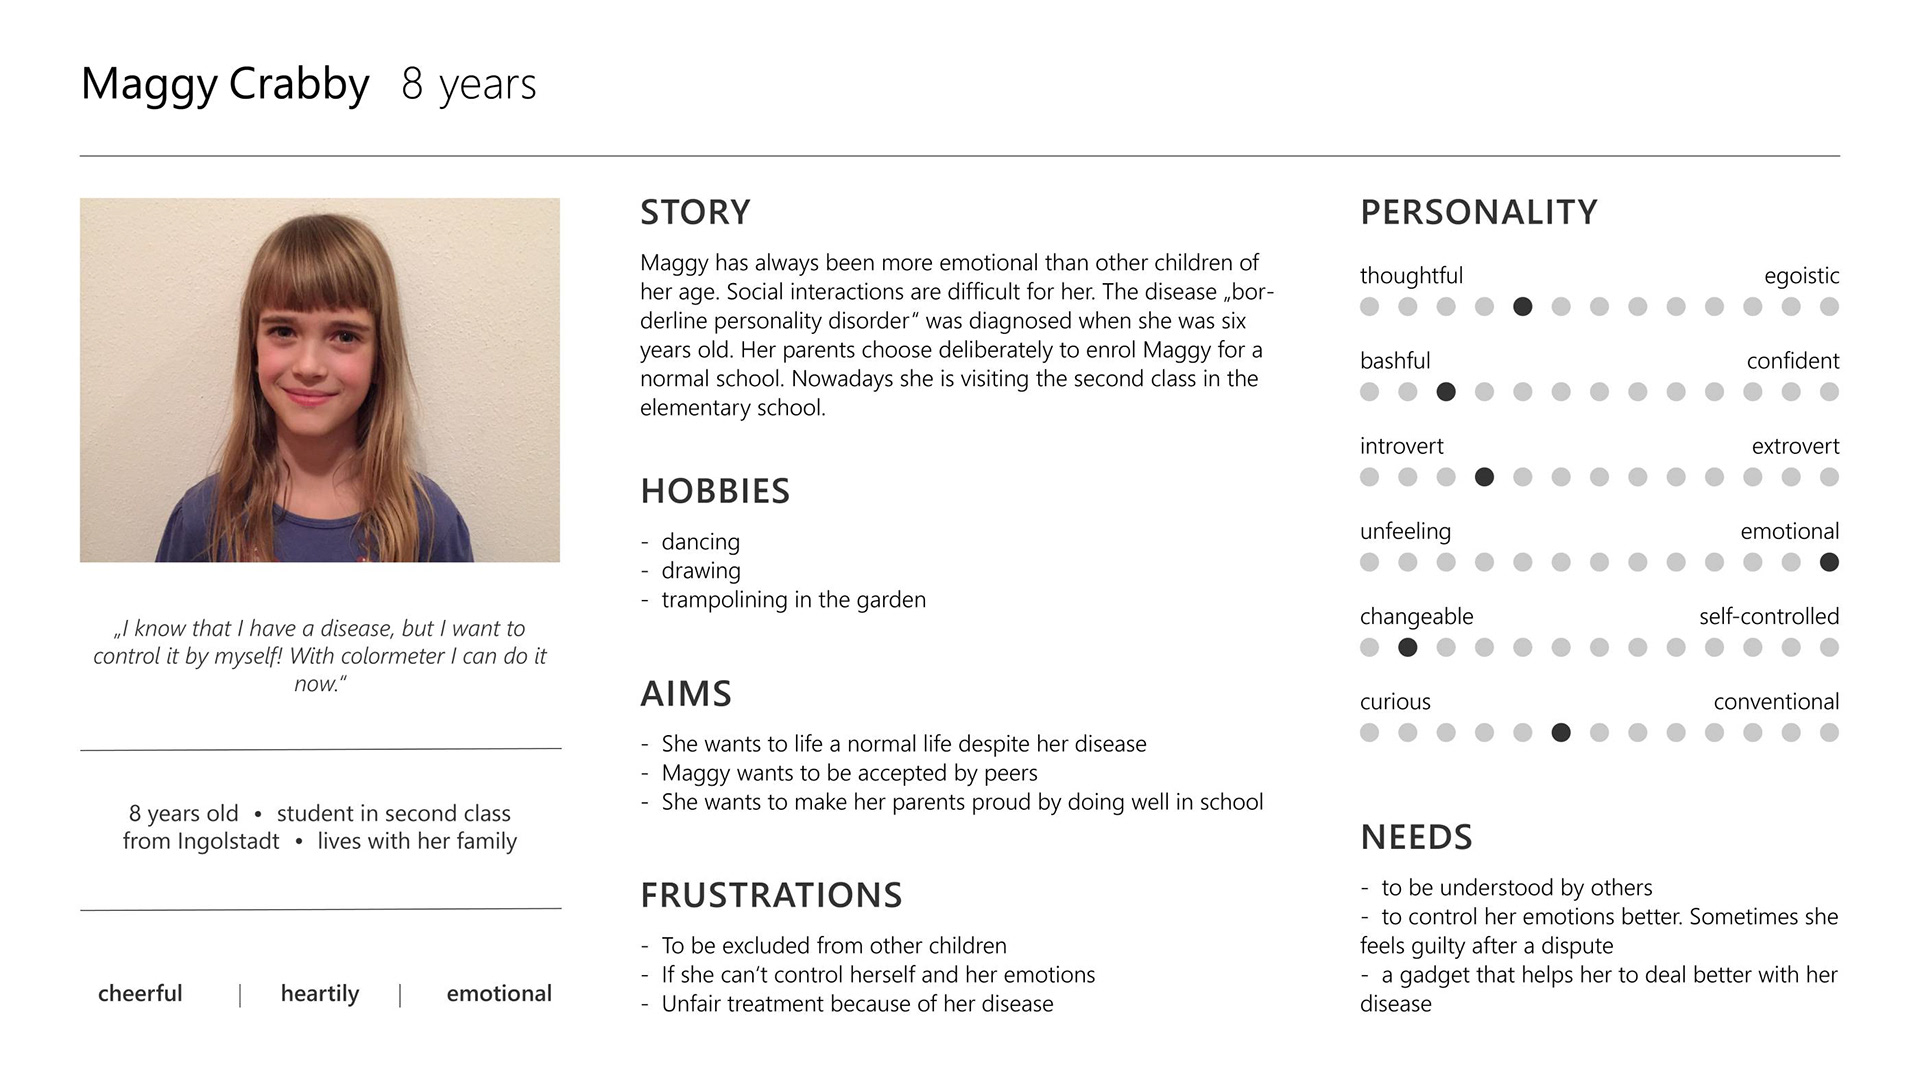
Persona Maggy Crabby
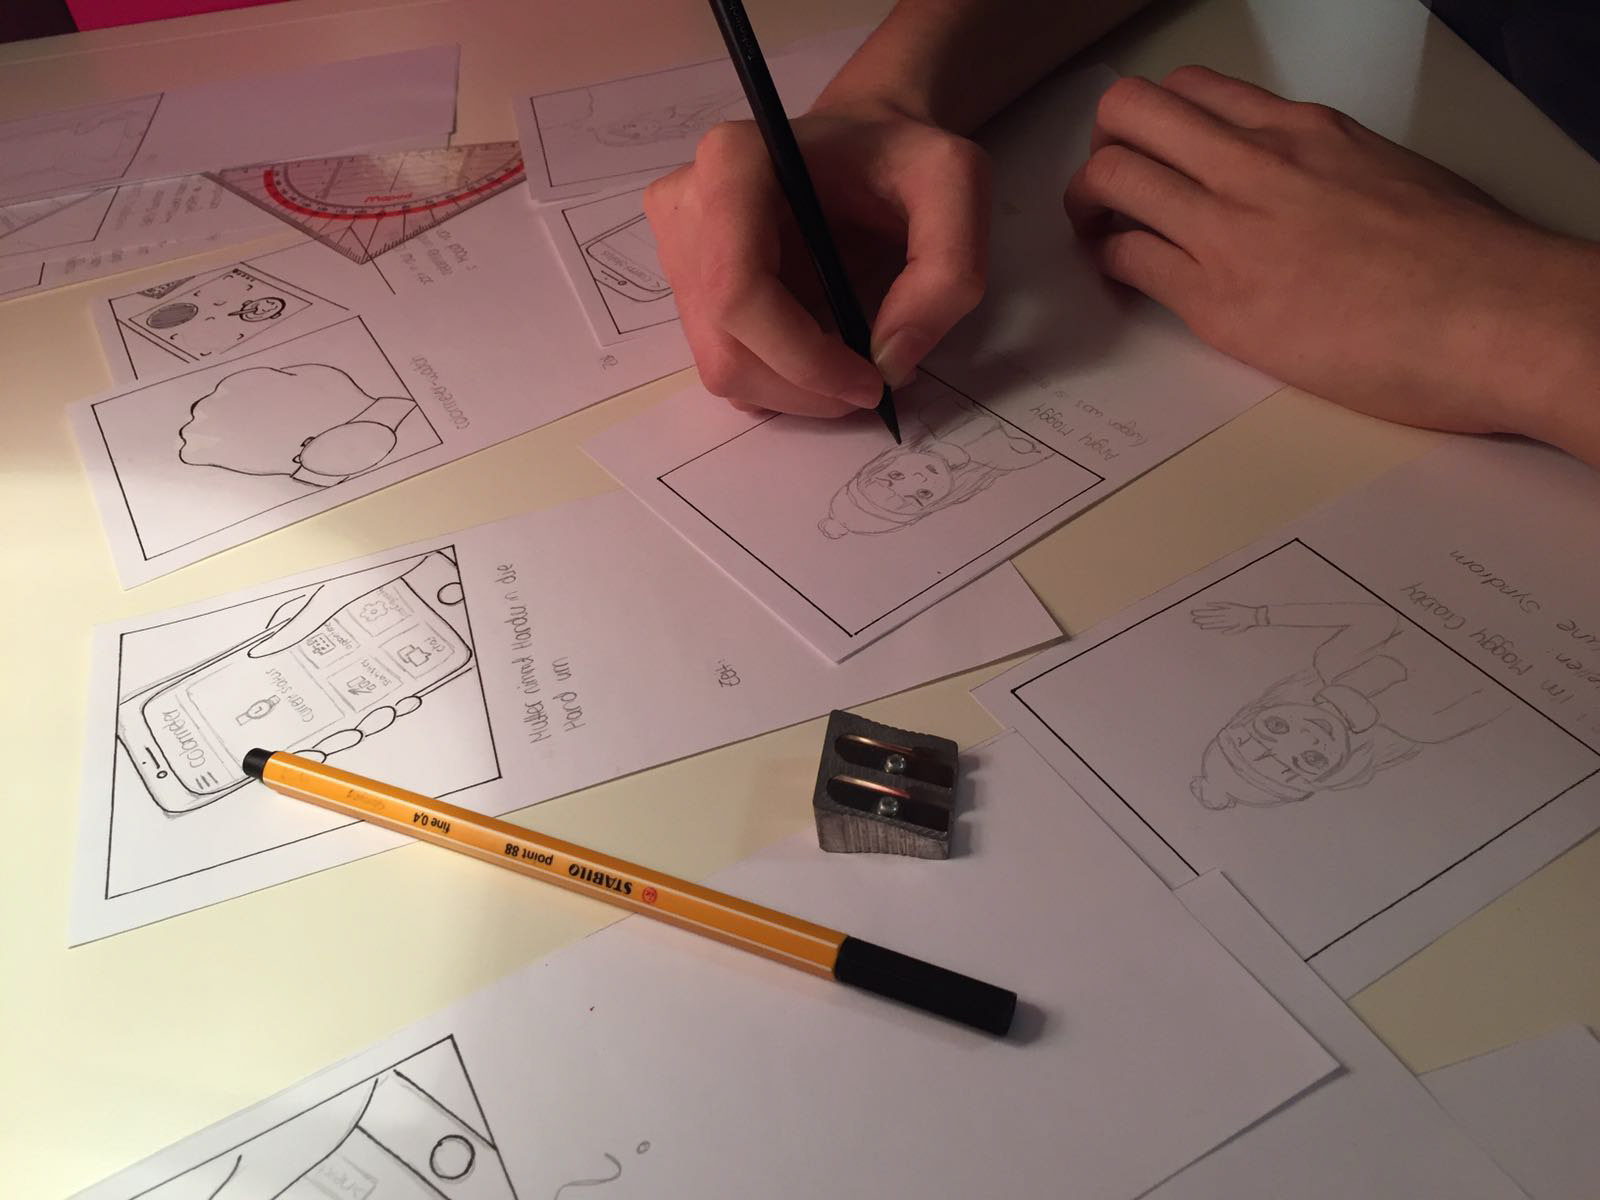
Storyboard sketches
Paper Prototyping & Wireframing
We developed paper prototypes and low-fidelity interactive wireframes to validate information architecture and interaction flows. These wireframes were tested with users to evaluate clarity, emotional impact, and usability. Early testing revealed that numerical stress indicators increased pressure, leading us to replace them with color transitions that frame emotions as dynamic states rather than fixed metrics.
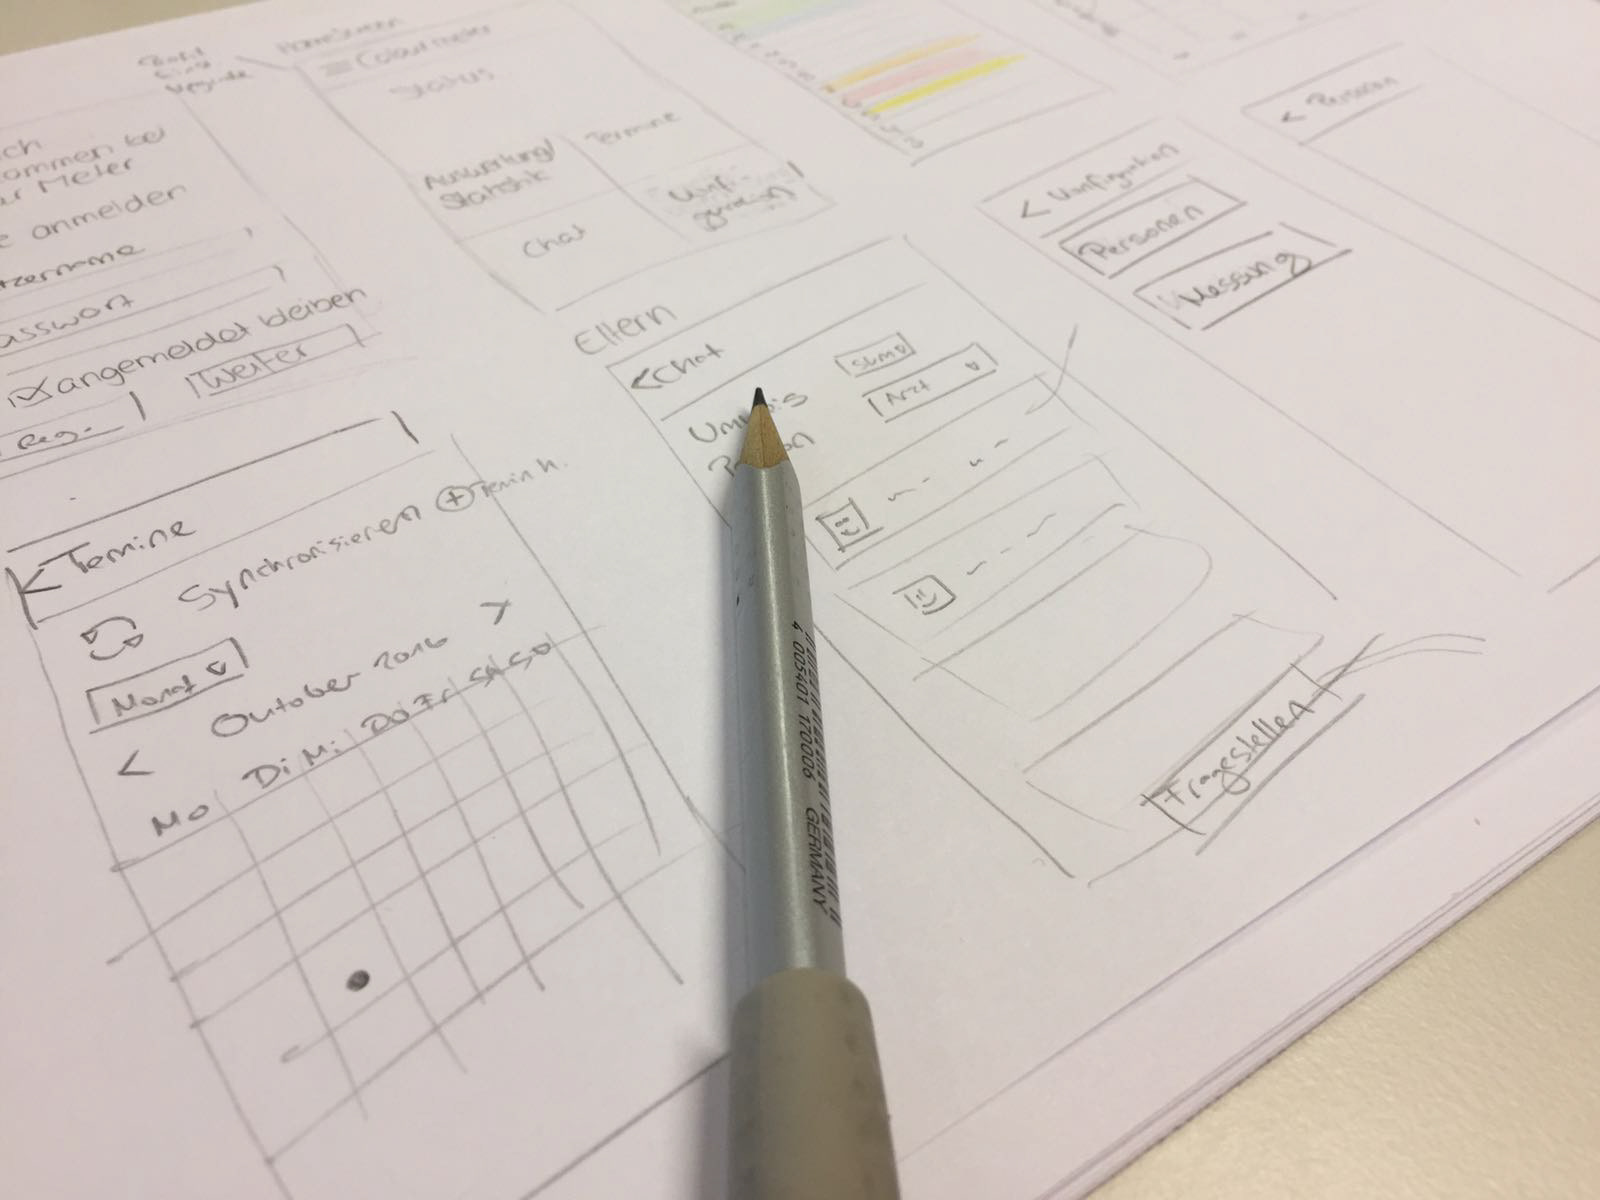
Sketches
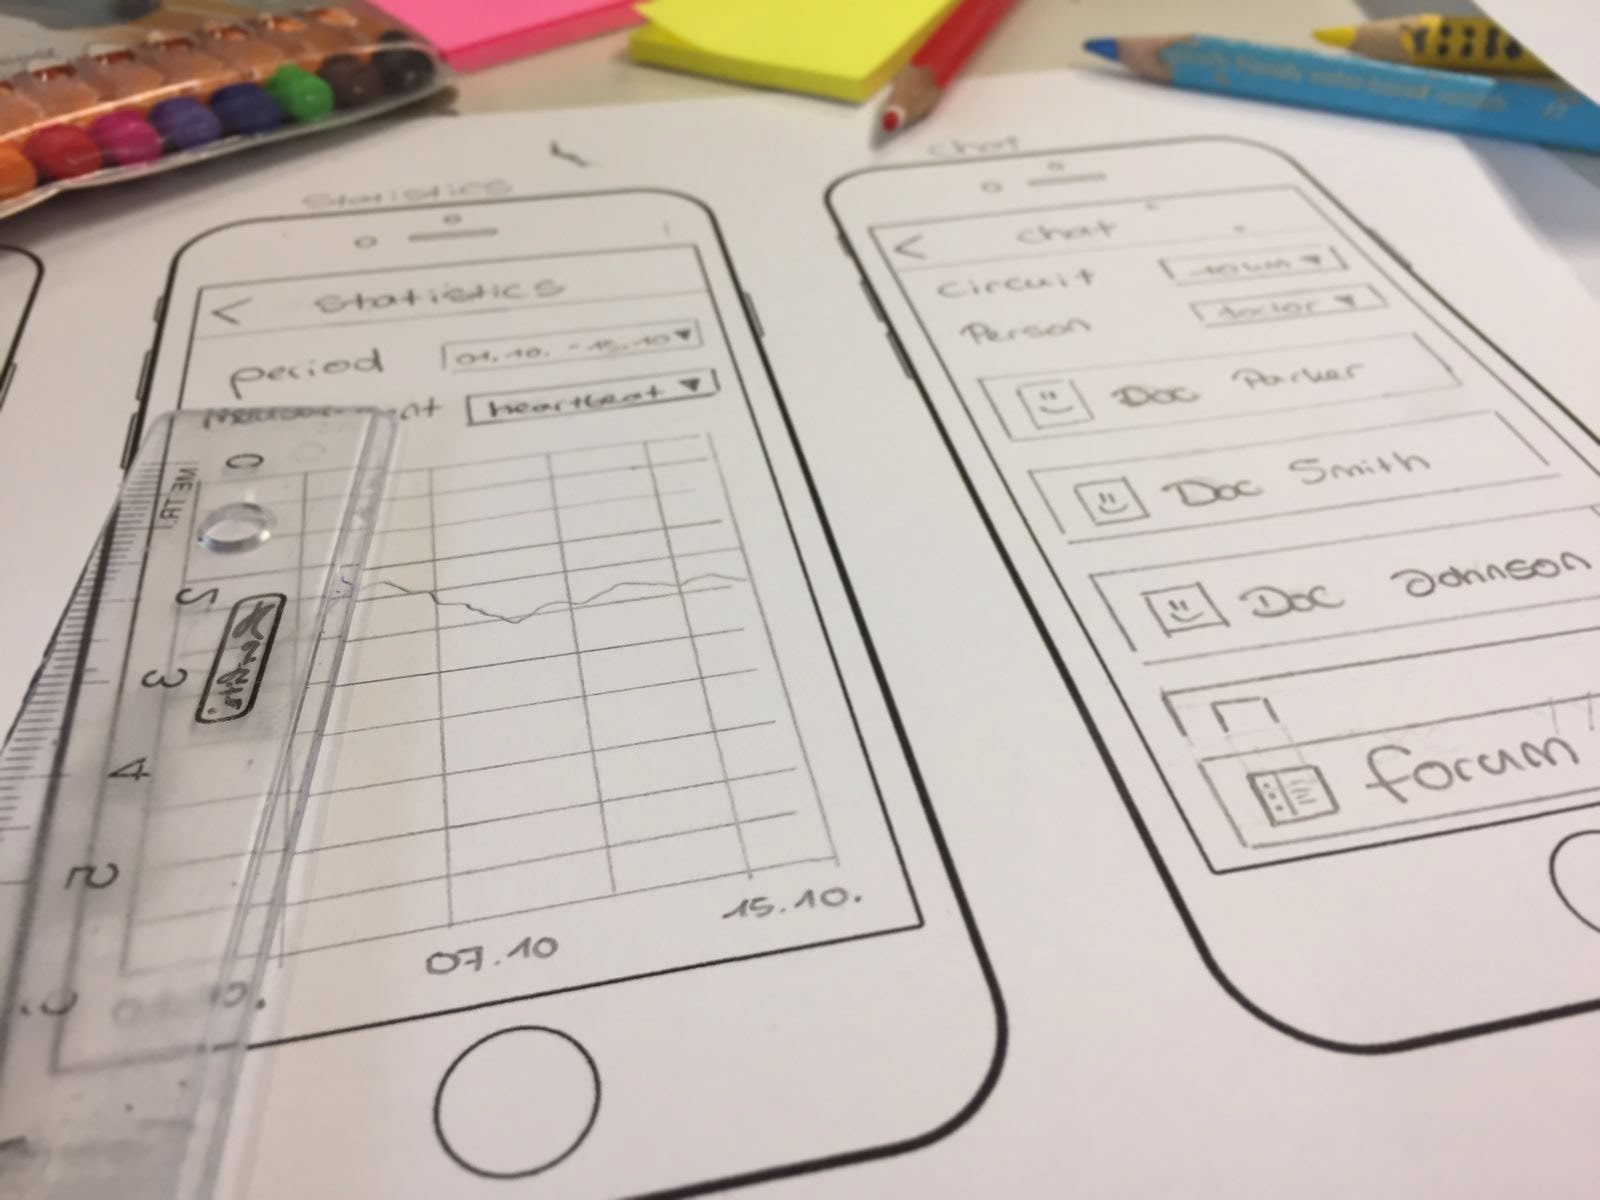
Paper prototypes
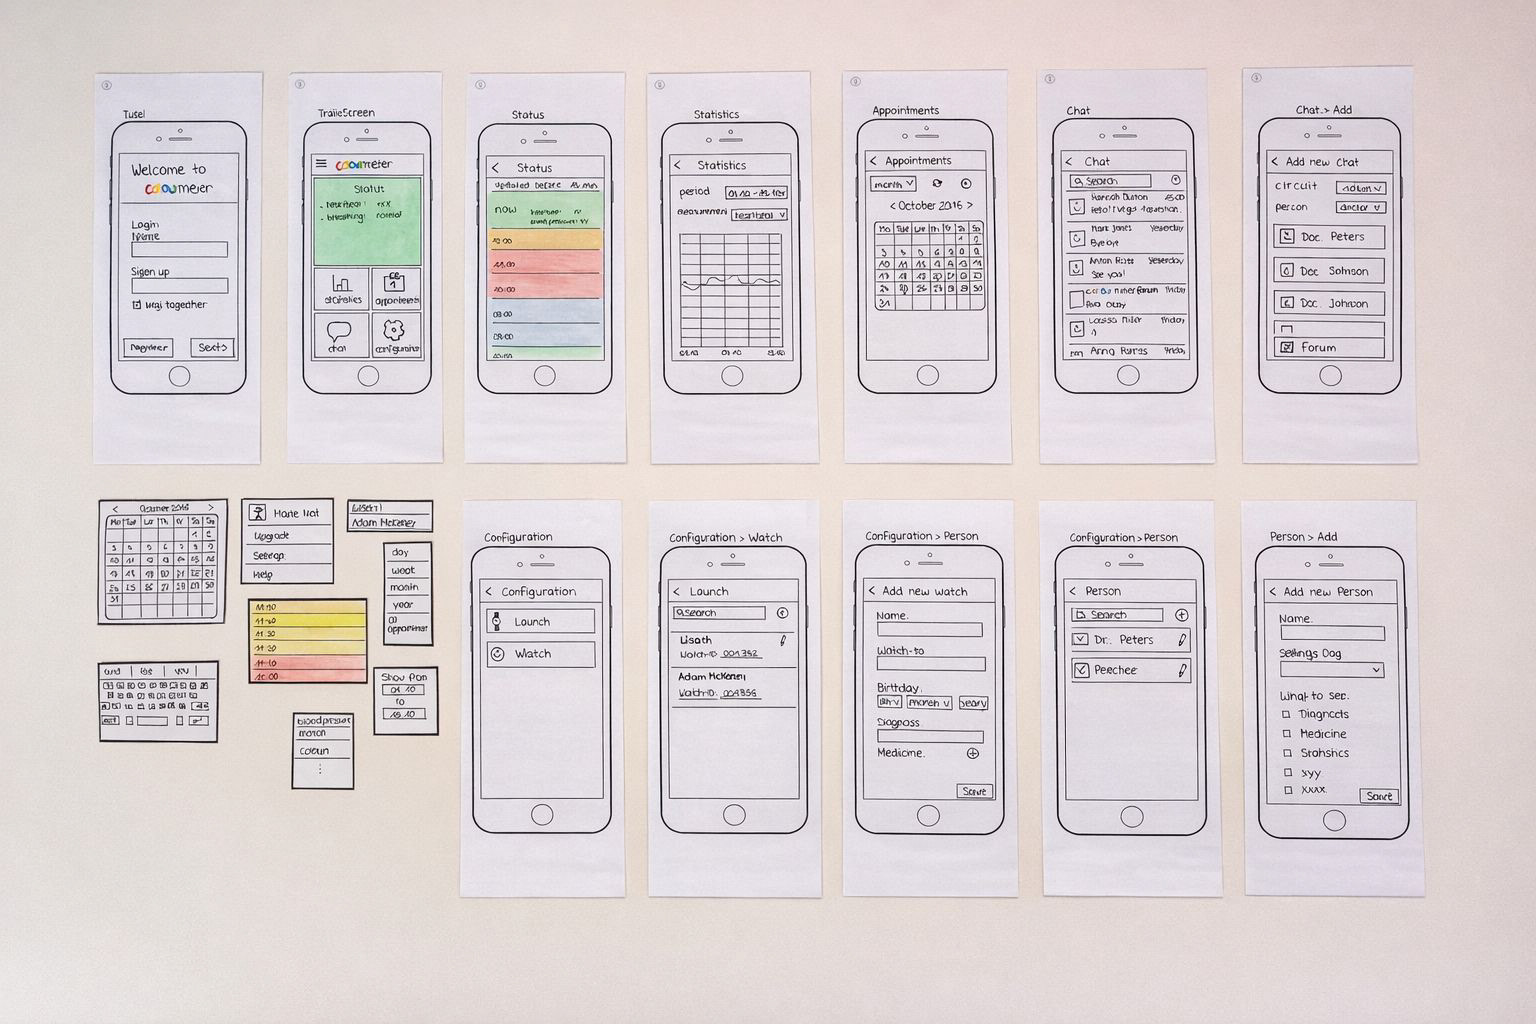
Paper prototypes
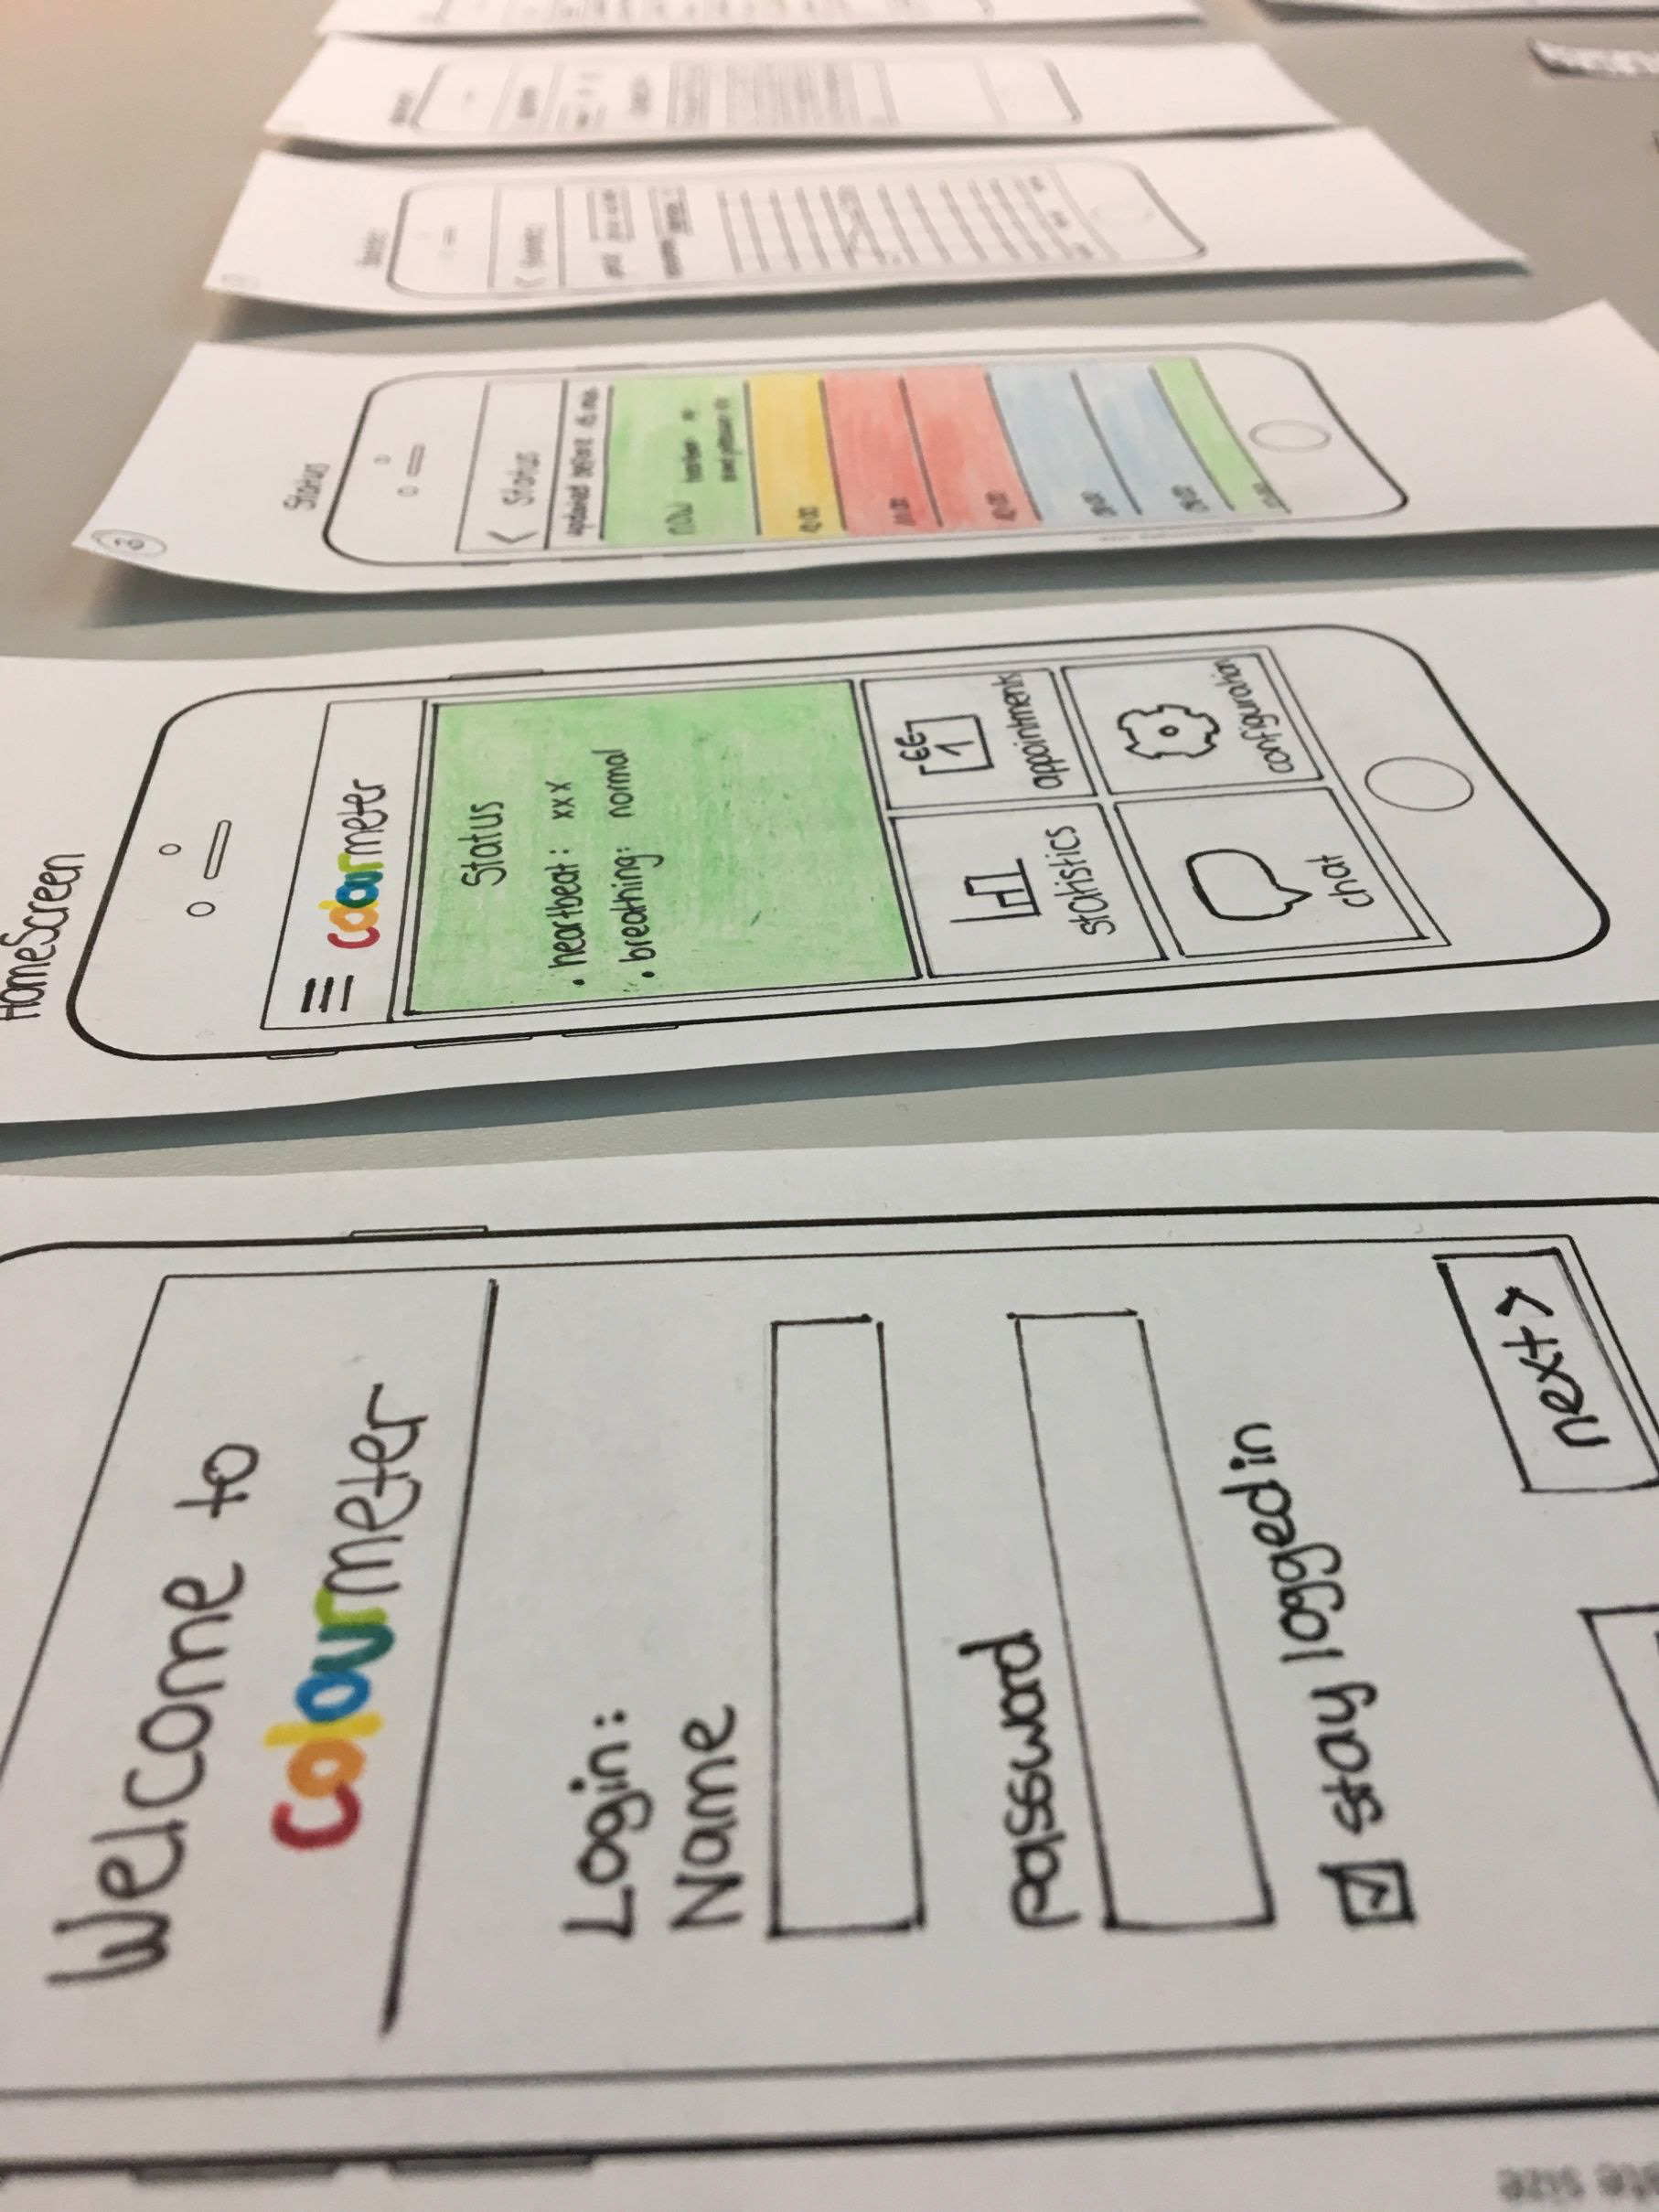
Paper prototypes
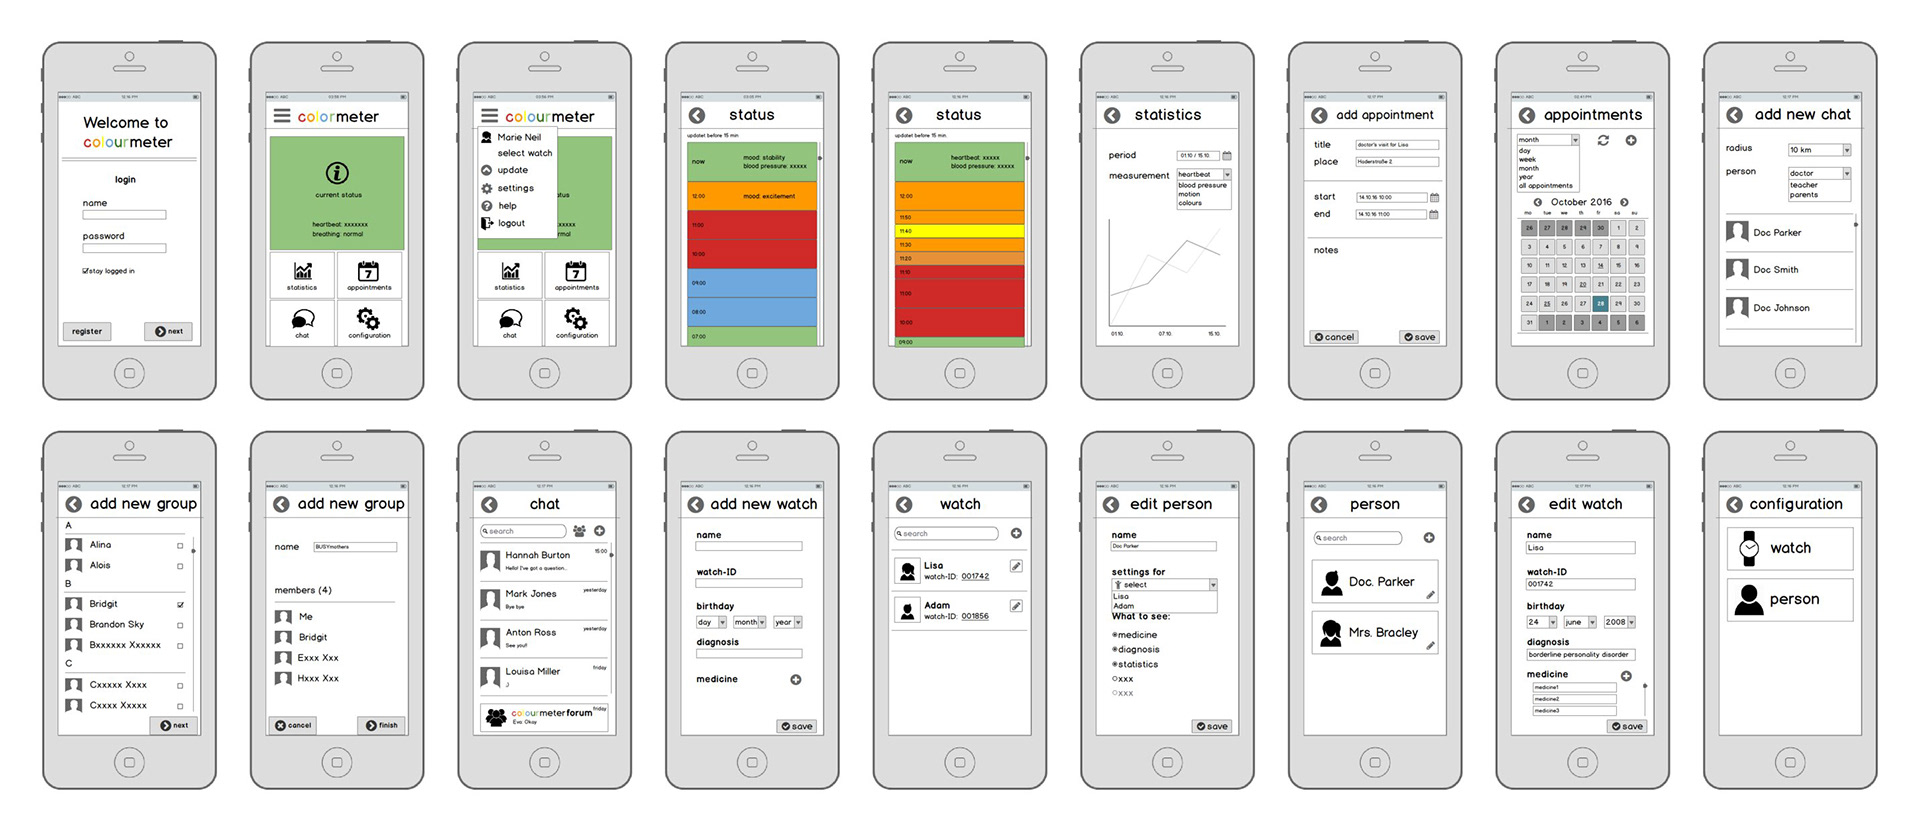
Interactive wireframes
Results
The final system makes emotional states visible in real time and reveals stress patterns over time, shifting the focus from reaction to understanding. Users found color-based signaling less confronting, while trend views enabled parents to engage more deliberately rather than reactively.
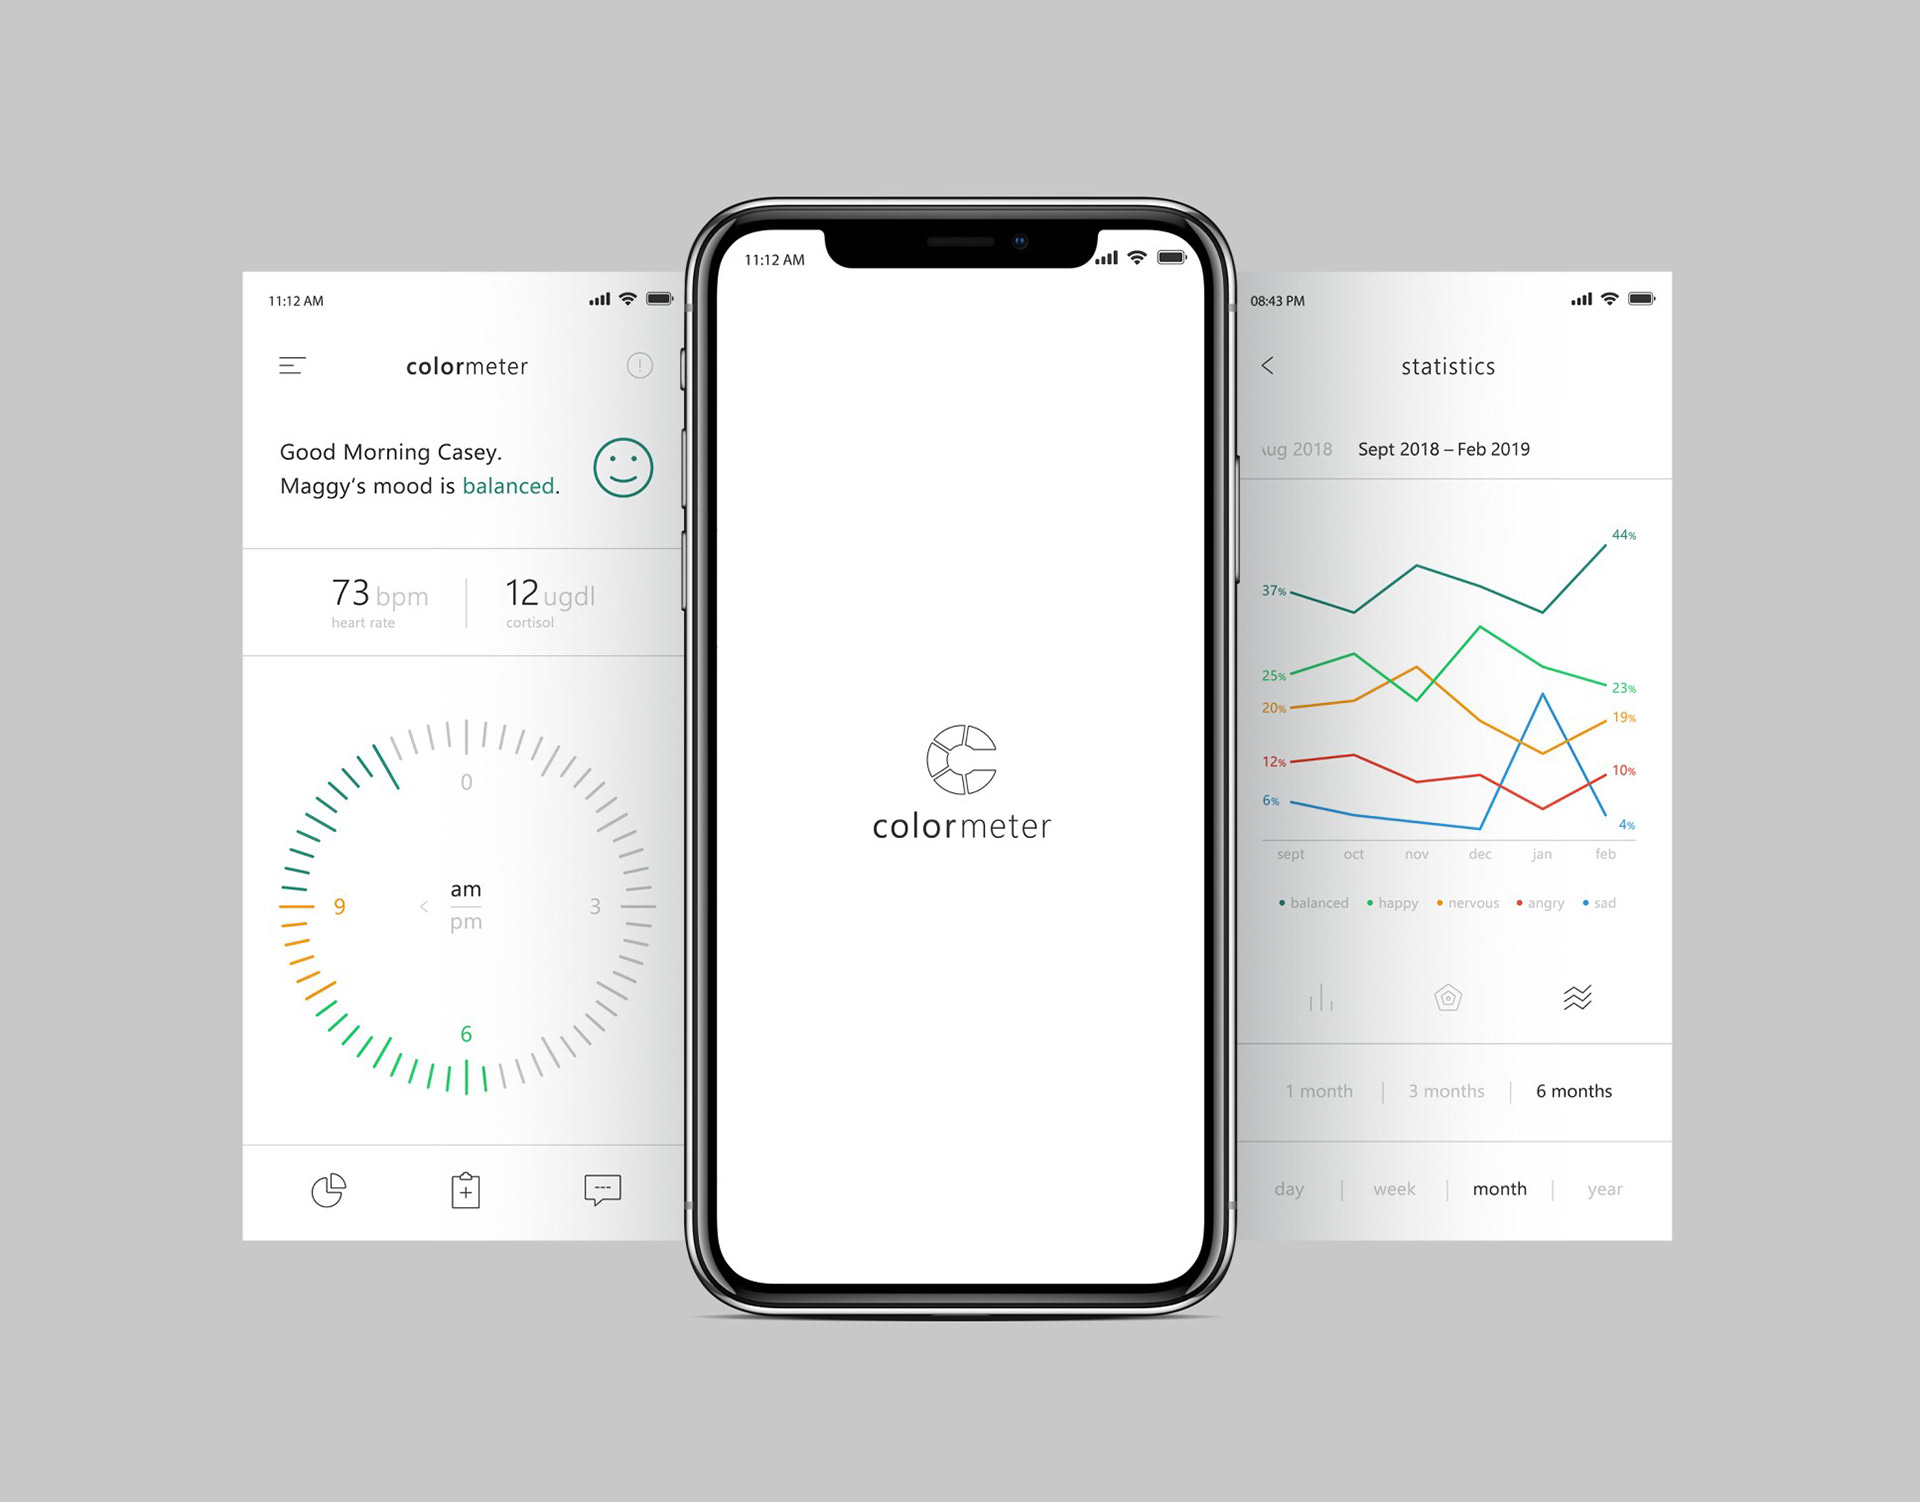
UI designs
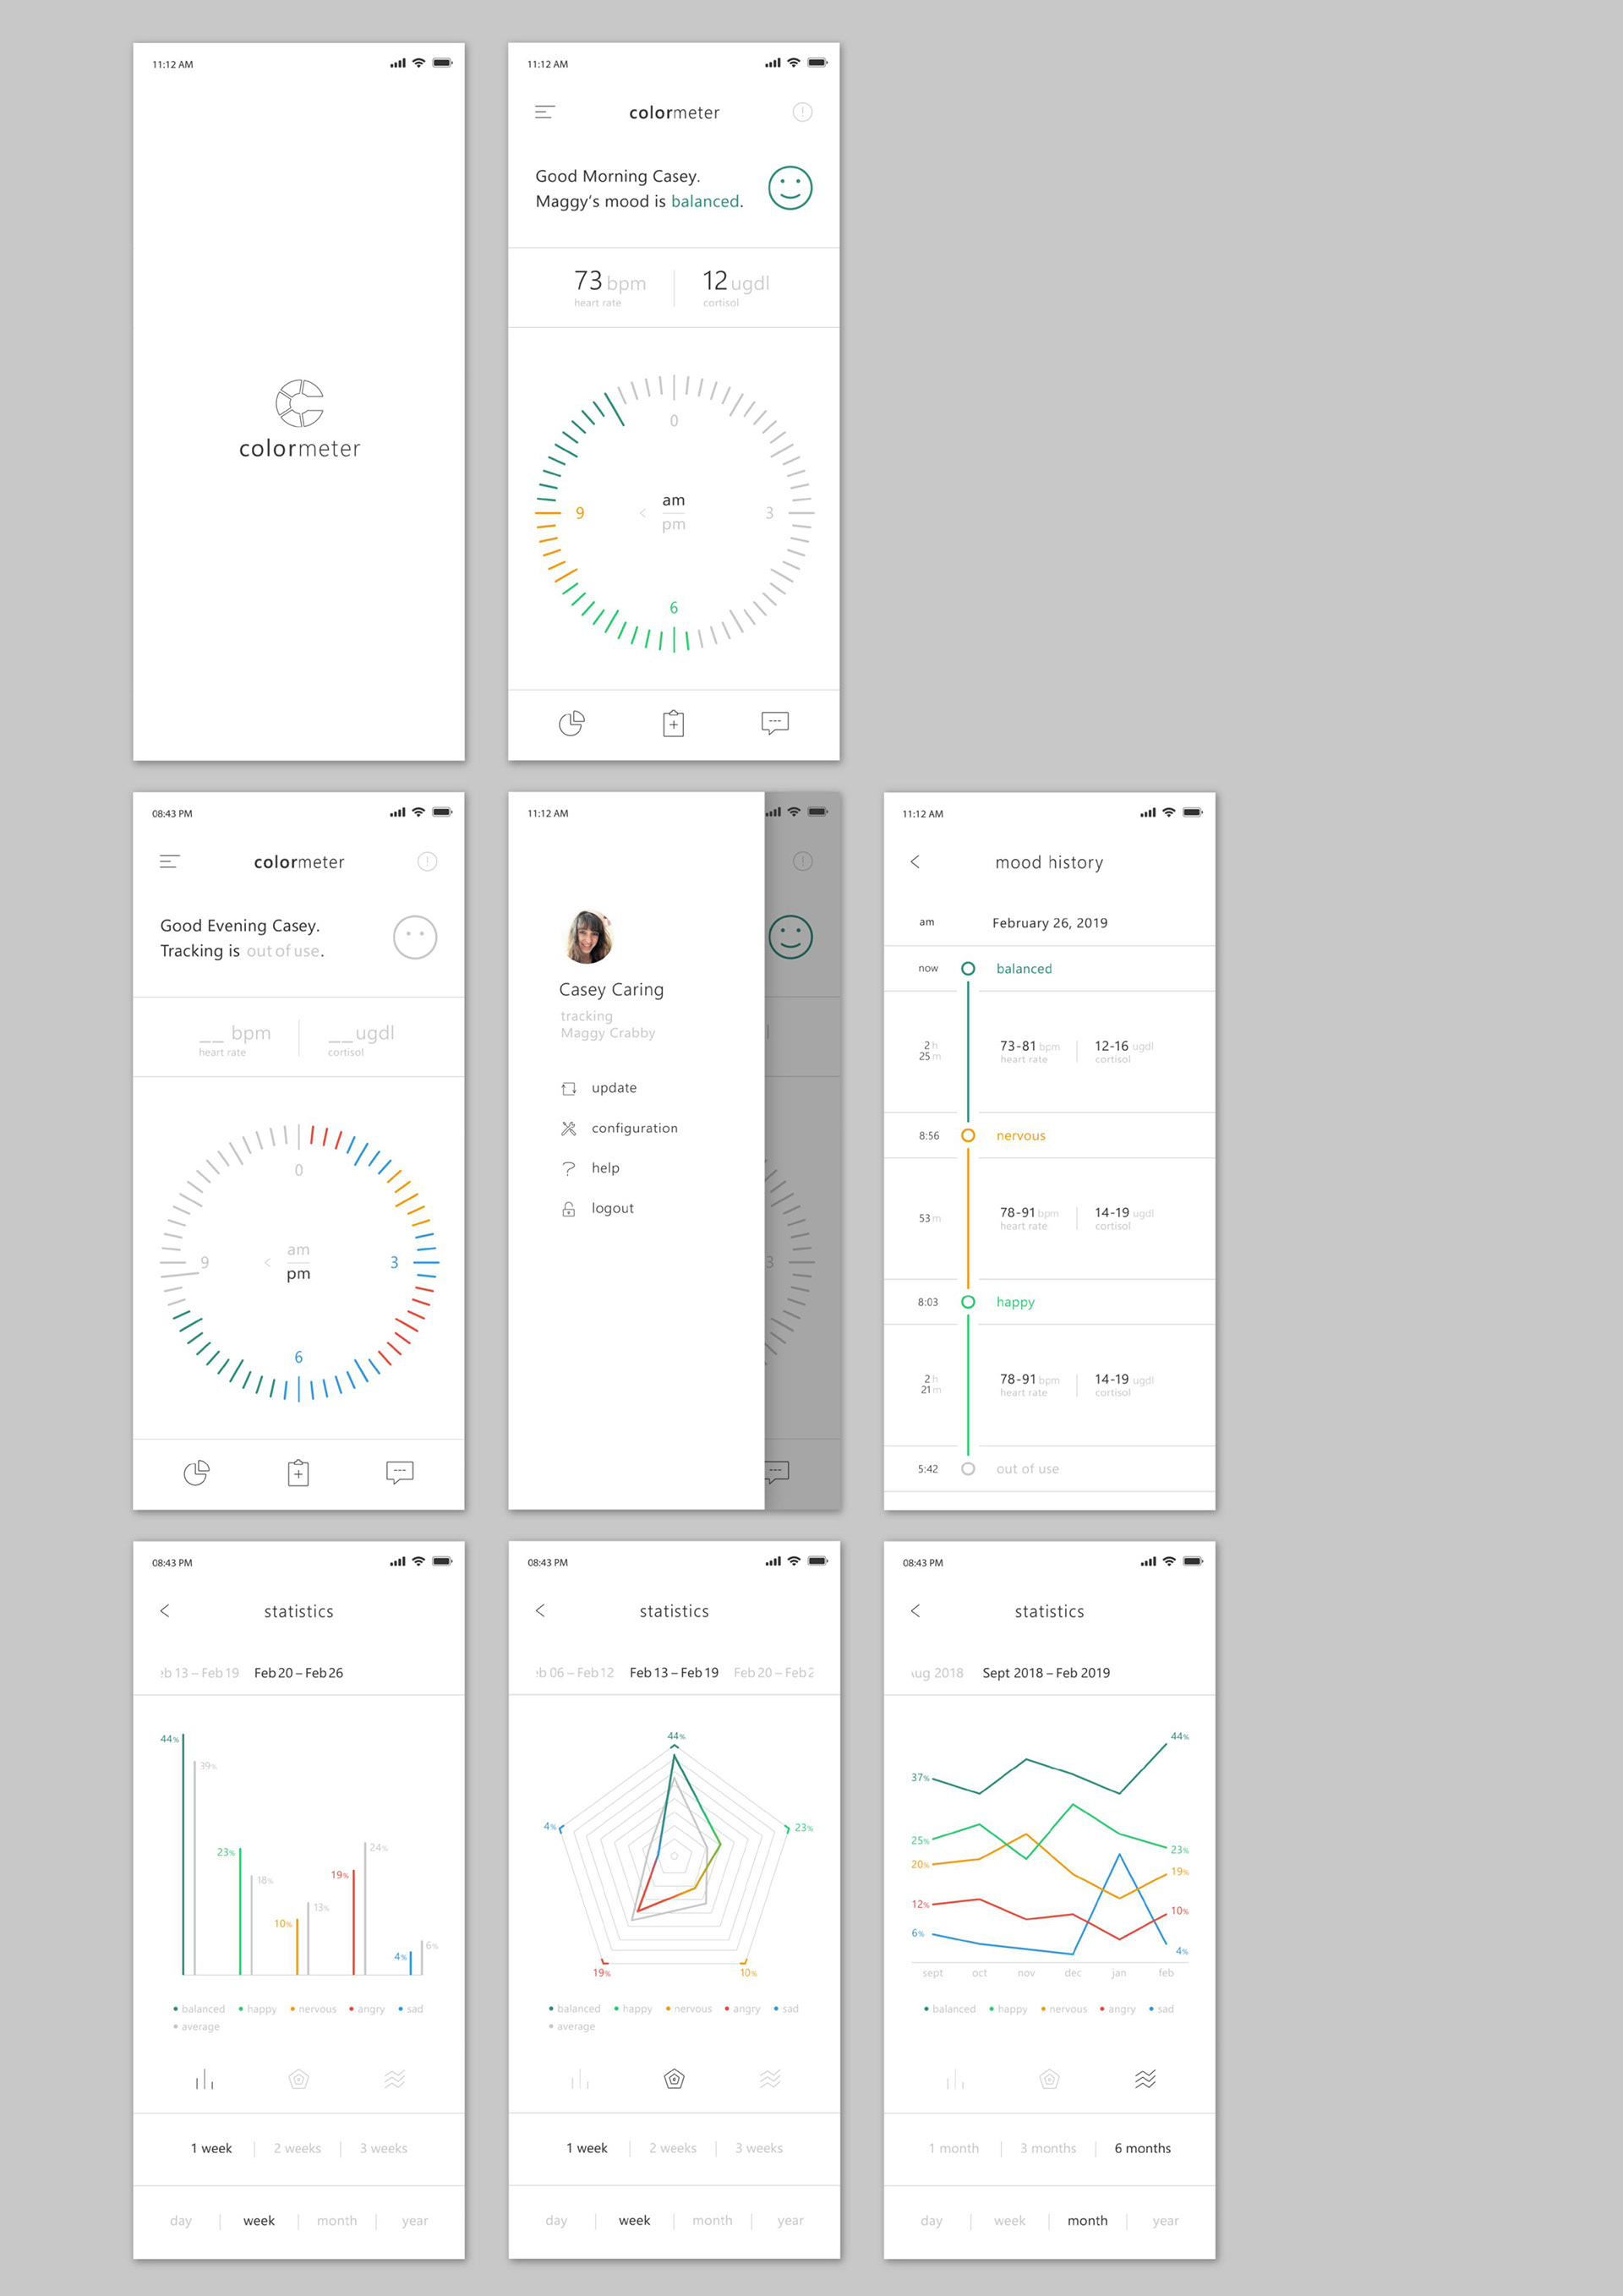
UI designs
Conclusion
Colormeter reframes emotional volatility into something interpretable, supporting more constructive family dynamics. Future iterations could extend this shared understanding to clinicians and caregivers through controlled data access, and evolve the system into a more holistic support ecosystem including community and treatment management.